
Most HR reports die in the boardroom. Someone presents twelve slides, the CFO glances at her phone, and the CEO asks one question: “So what does this cost us?”
The metrics that survive that question are few. Revenue per employee, human capital ROI, regretted turnover with its true attrition cost, the cost of a vacant seat, and a short block of risk numbers covering pay gaps, leadership diversity, safety and compliance losses. Everything else is background noise until you tie it to naira, execution or exposure.
Let’s go through why, and how to present them so they actually get used.
What Metrics in Human Capital Reports Matter to Executives?
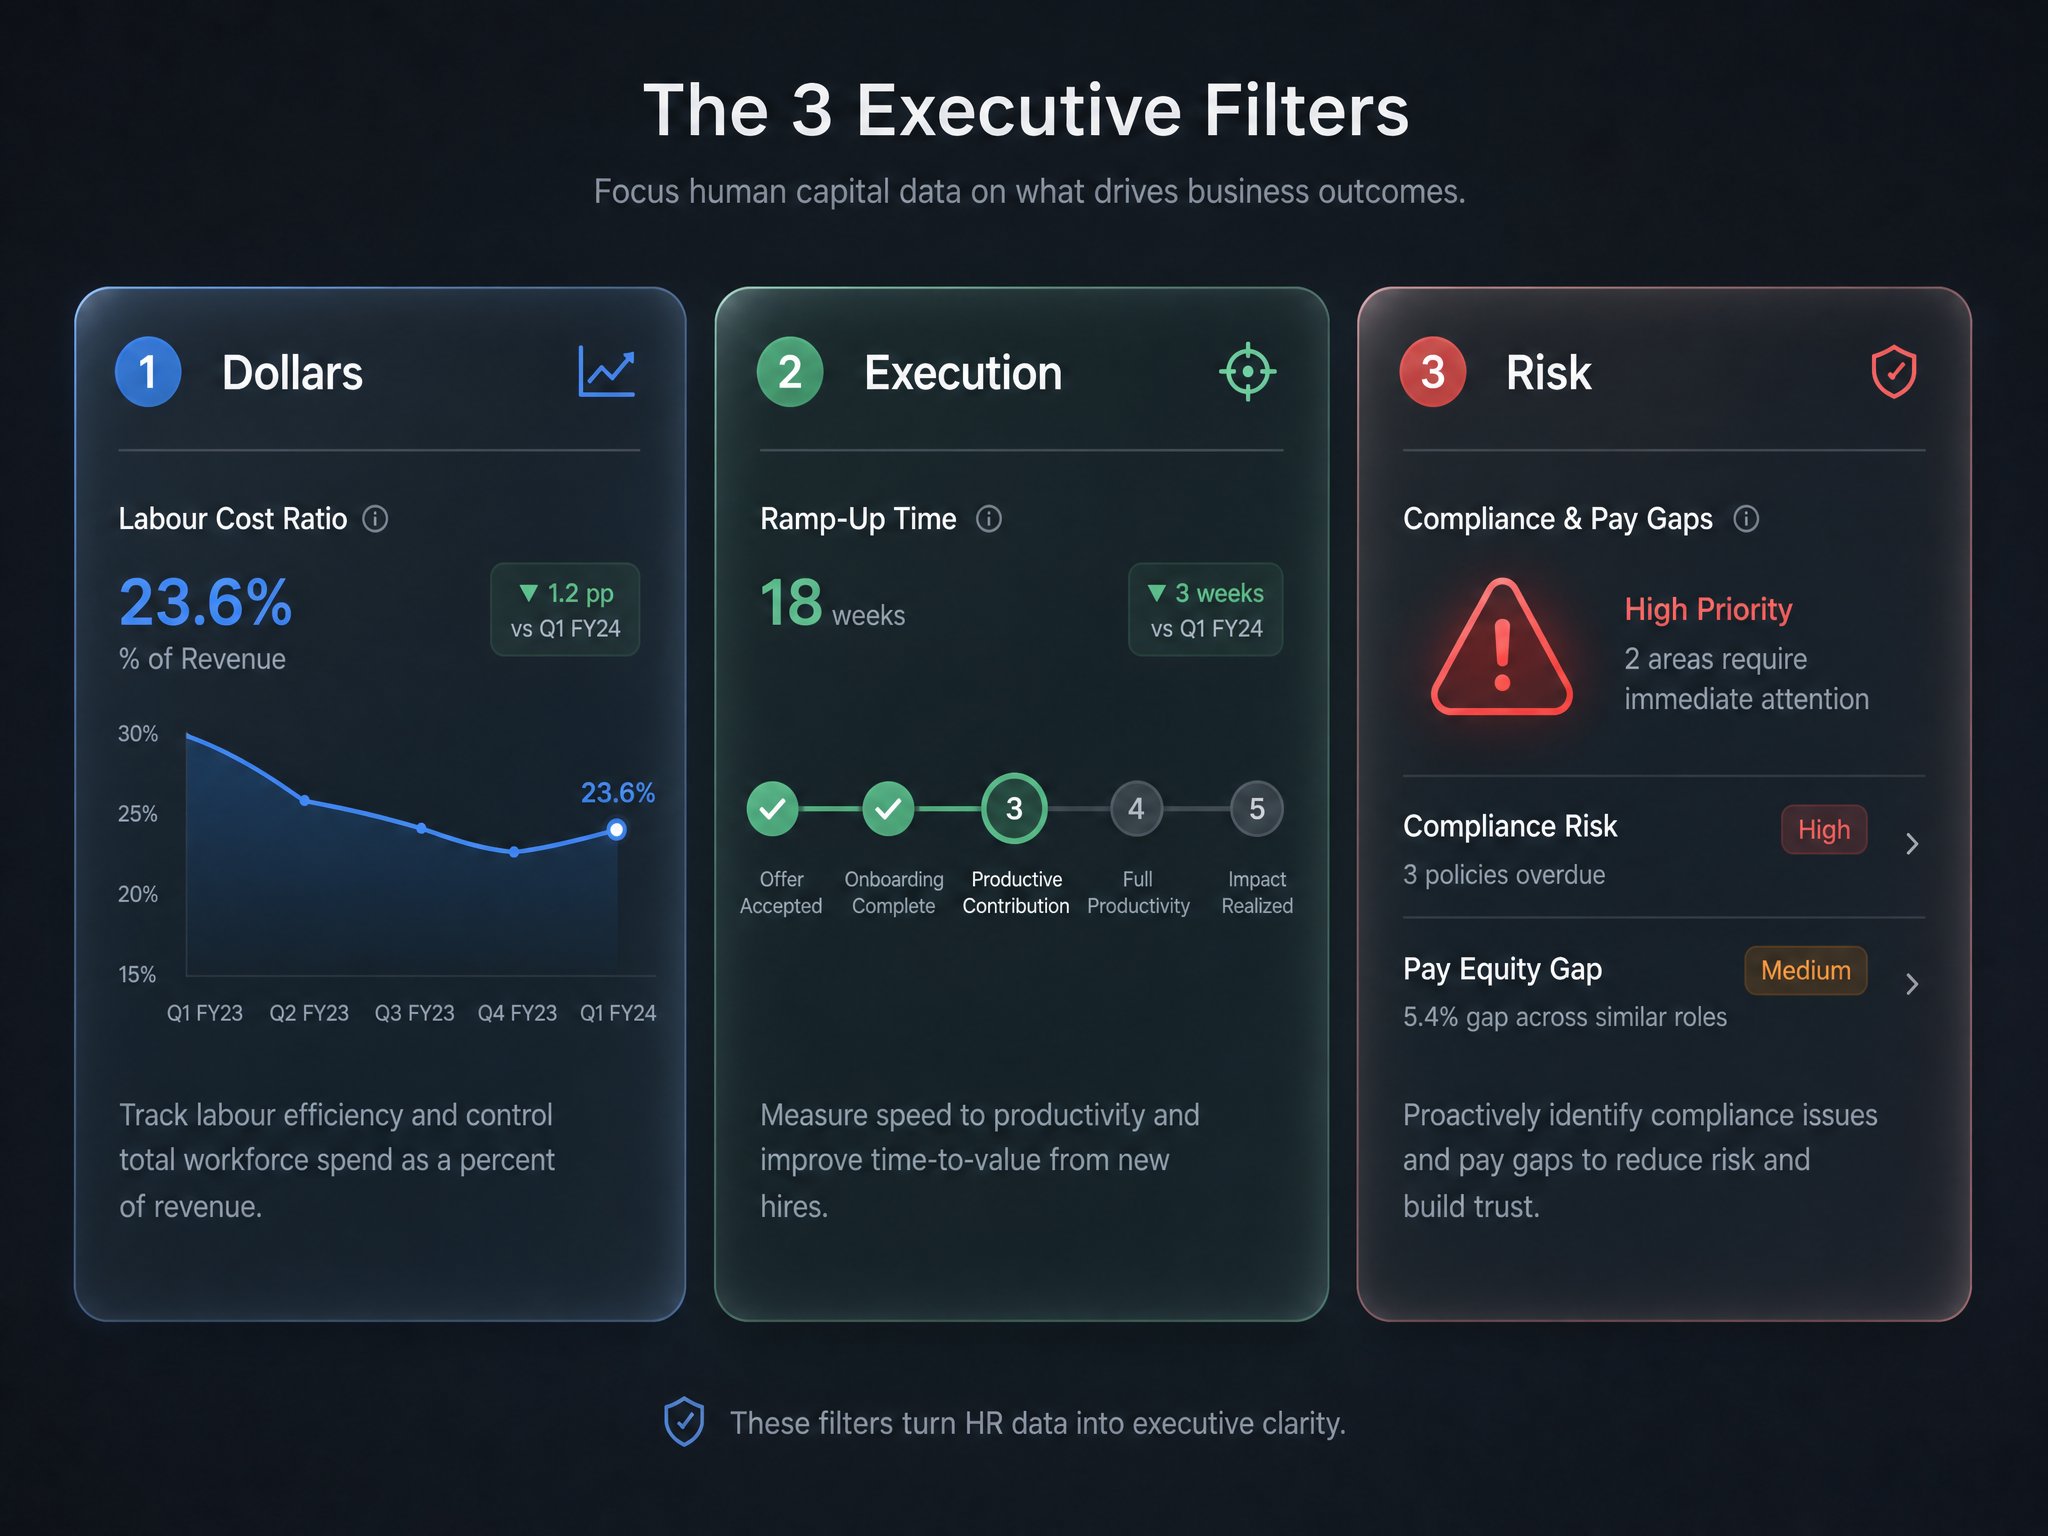
Executives read people data through three filters. Does it move money? Does it show the strategy is being delivered? Does it expose a risk someone must own?
If a metric fails all three, it is trivia.
Dollars
Labour can swallow somewhere between 20% and 60% of revenue depending on the sector, so the board wants proof the spend is earning something. Revenue per employee, human capital ROI and labour cost ratio sit here. They answer the plain question of whether the workforce pays for itself.
Execution
Can the organisation deliver the plan? Ramp-up time, quality of hire and regretted turnover speak to this. A strategy that needs forty engineers by September is only as real as your ability to hire, keep and productively deploy them.
Risk
Pay gaps, leadership diversity, injury rates and legal settlements belong here. Investors and regulators ask about them, and surprises in this category tend to land on the front page, not in an HR newsletter.
Why Do Executives Ignore Most HR Dashboards?

Because most of them were built for HR, not for the people signing the cheques.
Deloitte’s global human capital research, which pools views from over 9,000 business and HR leaders across 89 countries, keeps surfacing the same gap: leaders and workers see talent priorities differently, and reports rarely bridge it. So the dashboard gets built around activity. Activity feels productive. It rarely is.
Vanity Metrics
Training hours, wellness event attendance, handbook updates, basic headcount. Nice to report, easy to collect, and nobody on the executive floor can act on them. I have watched a team proudly present 4,000 training hours while the sales force missed target by a third. Awkward silence followed.
Operational Noise
Time-to-fill is the classic case. Forty-five days sounds fine or terrible depending on who you ask, and the number alone cannot say which. Without the revenue a vacancy is costing, it is just a stopwatch reading.
Missing Business Link
A metric with no bridge to revenue, cost, productivity or retention will be skipped. Always ask what decision this number could change. No decision, no slot on the page.
Which Productivity and Return Metrics Come First?
Open with these. They frame everything after.
Revenue per Employee
Total revenue divided by the number of employees (or FTEs, if you use many part-timers). A firm earning ₦6 billion with 300 people makes ₦20 million per head. Track the trend, and compare against peers through proper benchmarking, because a rising figure means capacity is being used well and a falling one means you are hiring faster than you are growing.
Human Capital ROI
This one measures profit returned for every naira spent on pay and benefits. The common formula strips non-labour expenses out of revenue, then divides what remains by total compensation cost. An HC-ROI of 1.4 says each ₦1 of people cost produced ₦1.40 above its own weight. Executives understand ROI instantly because they use the same logic on machinery and acquisitions.
Labour Cost Ratio
Labour cost as a share of revenue. Simple, brutal, and the first thing a CFO checks. If it climbs while revenue per employee stays flat, overtime or bloated management layers are usually hiding somewhere.
| Metric | What it measures | Business outcome it touches |
|---|---|---|
| Revenue per employee | Output per head | Revenue, productivity |
| Human capital ROI | Return on pay and benefits | Profitability |
| Labour cost ratio | Pay as a share of revenue | Cost control |
| Regretted turnover | Loss of valued people | Retention, execution |
| Cost of vacancy | Revenue lost per empty seat | Revenue, cost |
Which Retention Metrics Show Workforce Stability?
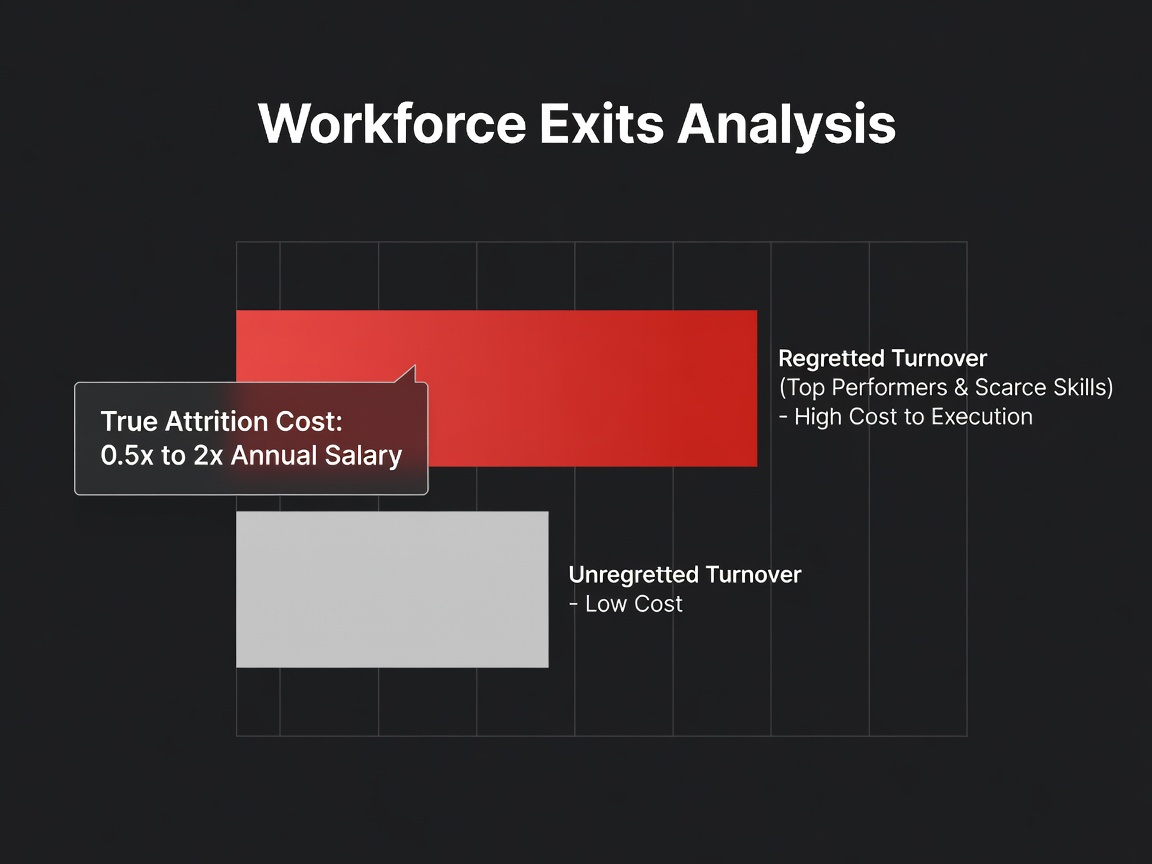
Overall turnover rate is a blunt tool. It lumps the star engineer with the person you quietly hoped would resign.
Regretted Turnover
The share of exits you wish had not happened: top performers, scarce skills, successors. A 12% overall attrition figure can hide the fact that half of it is your best talent. Forbes HR Council contributors make the same point about voluntary turnover cohorts mattering more to the C-suite than the headline number.
Voluntary Versus Involuntary Exits
Split them. Voluntary exits say something about culture, pay and management. Involuntary exits say something about hiring quality and performance management. Put them together and you learn nothing about either.
True Attrition Cost
Recruiting fees, lost output while the seat is empty, manager time, and the months a replacement needs to reach full speed. Commonly cited estimates run from half to two times annual salary for a skilled role, though your own payroll data will beat any rule of thumb. Show it as one naira figure. Executives remember totals.
How Do Hiring Metrics Become Executive Metrics?
By being translated. Cost per hire and time-to-fill are inputs. Executives want consequences.
Cost of Vacancy
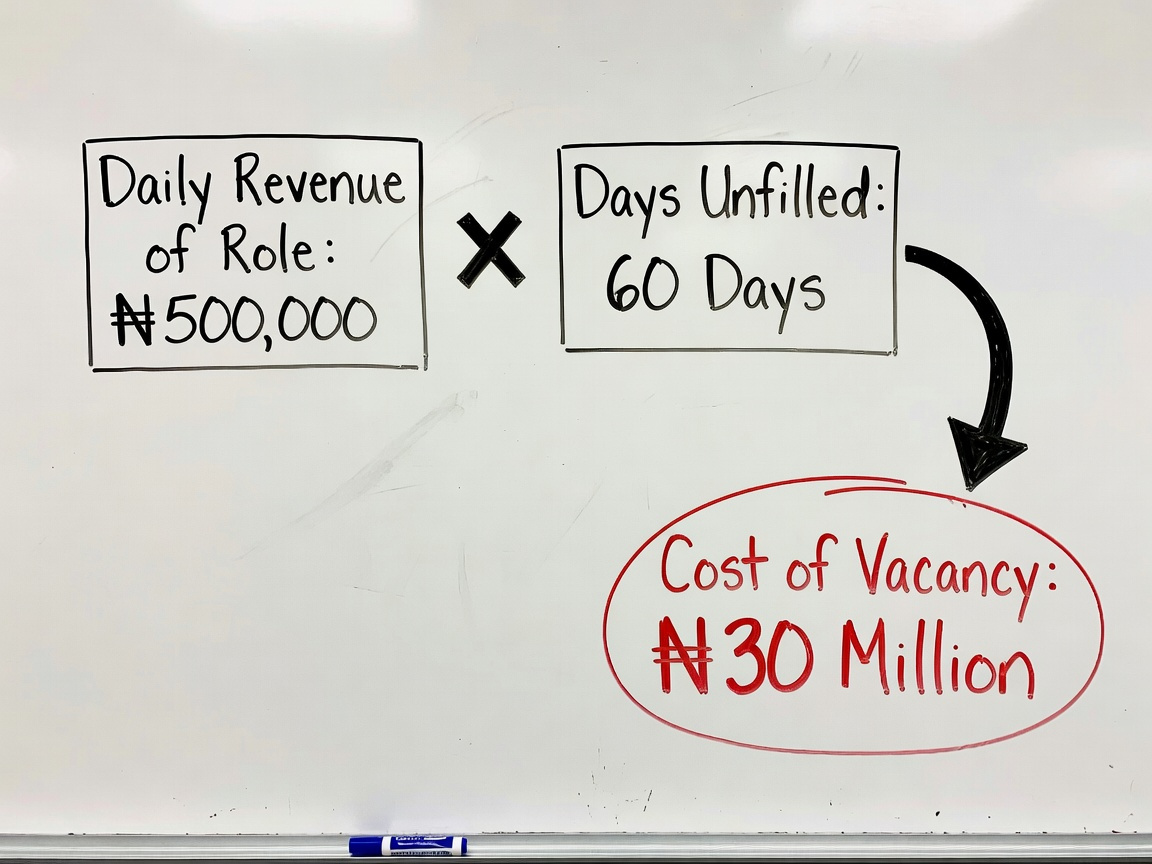
Daily revenue contribution of the role multiplied by days unfilled. A sales manager who brings in ₦500,000 a day and sits vacant for 60 days has cost you ₦30 million. Now the recruitment process has a price tag, and nobody calls it noise.
Quality of Hire
Performance rating, retention at twelve months and hiring manager satisfaction, blended into one score. It tells leadership whether the money spent on sourcing bought anything.
Ramp-Up Time
How long until a new person performs at expected level. The same Forbes discussion argues time-to-productivity beats time-to-hire as a boardroom measure, and I agree. A fast hire who takes nine months to deliver is slower than it looks.
Which Risk and Governance Metrics Belong on the Page?
Keep them. They are not filler.
Pay Gaps
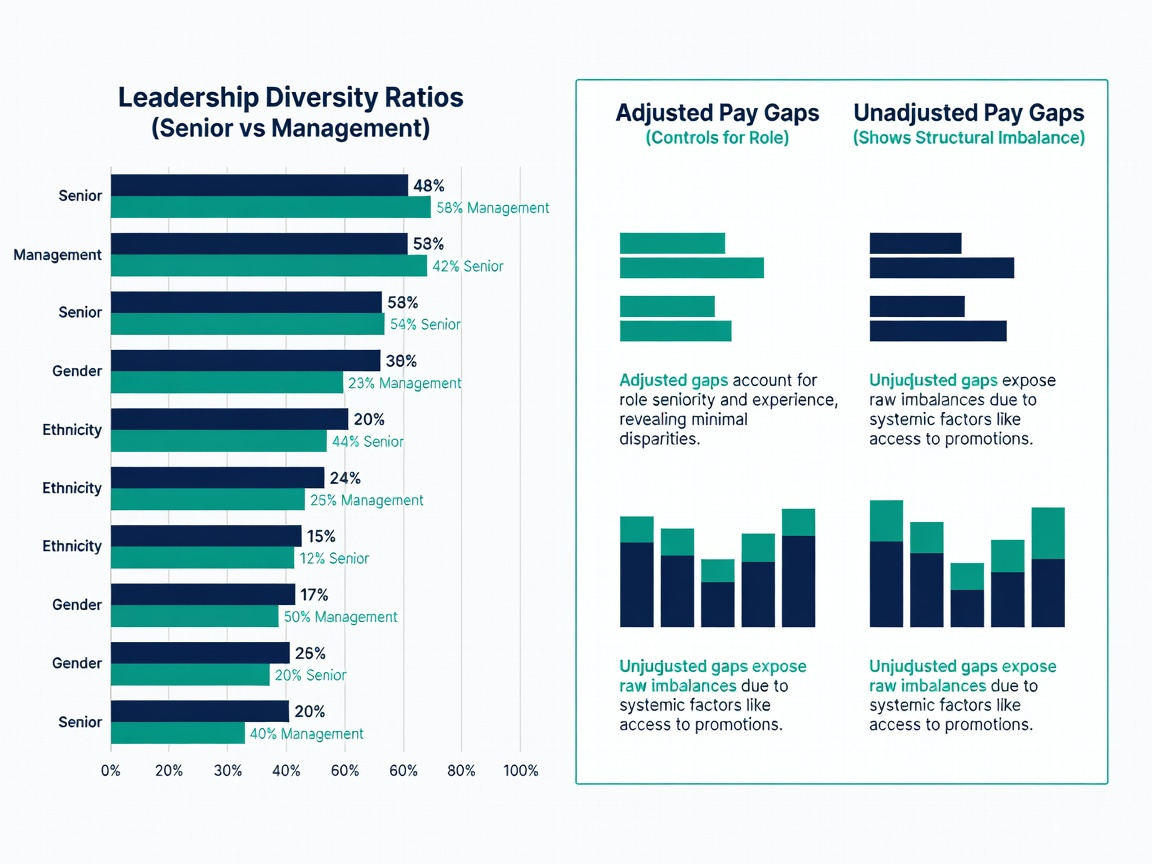
Report both unadjusted and adjusted gender and ethnicity gaps. The adjusted figure controls for role and level, the unadjusted one shows structural imbalance. Legal exposure and reputation risk both live here.
Leadership Diversity
Representation at senior and management level, not company-wide averages that flatter the picture. EY’s technical guide on SEC human capital disclosure lists leadership diversity ratios and turnover of high performers among the material items companies weigh disclosing.
Safety and Compliance Losses
Total recordable incident rate, plus the money lost to settlements, fines and employee claims. DFIN’s review of SEC disclosure practice ties injury rates and training investment to how sustainability is judged. In manufacturing, oil and gas or logistics, this block can outrank everything above it.
How Do You Select and Present Metrics for the C-Suite?

Start small. The ISO 30414:2025 standard runs to 69 metrics across 11 areas, and PwC’s Saratoga framework tracks over 150. Useful libraries. Terrible dashboards.
Pick six to eight, using three tests:
- Does it connect to revenue, cost, productivity or retention?
- Can an executive act on it this quarter?
- Can you defend the data when the CFO challenges it?
Lead with the headline number, put the trend beside it, then give one sentence on what you recommend. Pull figures from your HR analytics tools only after finance has agreed the definitions of revenue and labour cost, or the first meeting becomes an argument about arithmetic.
How Do HR Metrics Align With Business Strategy?
Pick metrics after the strategy, never before. A company expanding into new states needs hiring speed and ramp-up time on the page. A company defending margins needs labour cost ratio and productivity.
The payoff is real. McKinsey’s Organizational Health Index reports that top-quartile organisations deliver three times the total shareholder returns of weaker peers. And Gallup’s Q12 meta-analysis, covering more than 3.3 million employees, links engagement to profitability and retention outcomes. People data and business results do move together. Your job is to show the connection.
FAQ
What is the single most important human capital metric for executives? Revenue per employee, usually. It is simple, comparable and tied directly to productivity.
Is employee engagement worth reporting? Only when linked to outcomes such as retention or output. Alone, an engagement score is a mood reading.
How many metrics should a C-suite report contain? Six to eight. More than that and attention drifts.
How often should executives see them? Quarterly for the full set, monthly for fast-moving items like vacancies and incidents.
Conclusion
Executives are not hostile to people data. They are allergic to data that cannot answer “so what?”
Lead with revenue per employee and human capital ROI. Show regretted turnover with its real cost. Price your vacancies. Keep pay gaps, leadership diversity and safety losses visible. Cut the rest.
Do that for one quarter, and watch who starts looking up from their phones.