
The metrics that track mentorship effectiveness in pitch contests fall into four buckets: pitch quality (how much the pitch improved), goal achievement (did founders hit their milestones), founder capability (confidence and Q&A readiness), and business impact (funding, revenue and growth months after the stage lights go off). However, mentor hours don’t make the list.
Most organisers get this wrong. They run a three-week mentorship program, crown a winner, post the photos, and call it a success.
But did the mentoring work? Or did a good team simply win?
You can’t tell from a trophy. Honestly, you can’t tell from a happy-face survey either. If you run pitch contests in Lagos, Nairobi, London or Los Angeles, the problem is the same: sponsors want proof, and “everyone loved it” is not proof.
So let’s build a measurement system that holds up when a sceptical funder starts asking questions.
What Metrics Track the Effectiveness of Mentorship in Pitch Contests?
Short answer: a mix of process data and outcome data, tied to a baseline you set before the first session. Process data tells you whether the mentoring is moving things. Outcome data tells you whether movement turned into money.
Leading Indicators
Leading indicators show up while the mentorship program is still running. Think rubric score changes between the first draft and the dress rehearsal, the percentage of agreed milestones completed, session attendance, and how quickly a founder acts on feedback.
They’re early warnings. If a mentee’s pitch score is flat after four sessions, you’ve still got time to change the pairing.
Lagging Indicators
Lagging indicators arrive late and they’re stubborn. Funding closed, follow-on investor meetings, revenue growth, jobs created, survival of the business. Kauffman Foundation’s brief on measuring accelerator performance leans on exactly this sort of long-term venture data, including revenue velocity and employment creation.
The catch is that lagging data takes patience, and organisers hate waiting.
Four Metric Categories
Evaluators generally sort everything into four groups, and I find the sorting useful because it stops you from drowning in numbers.
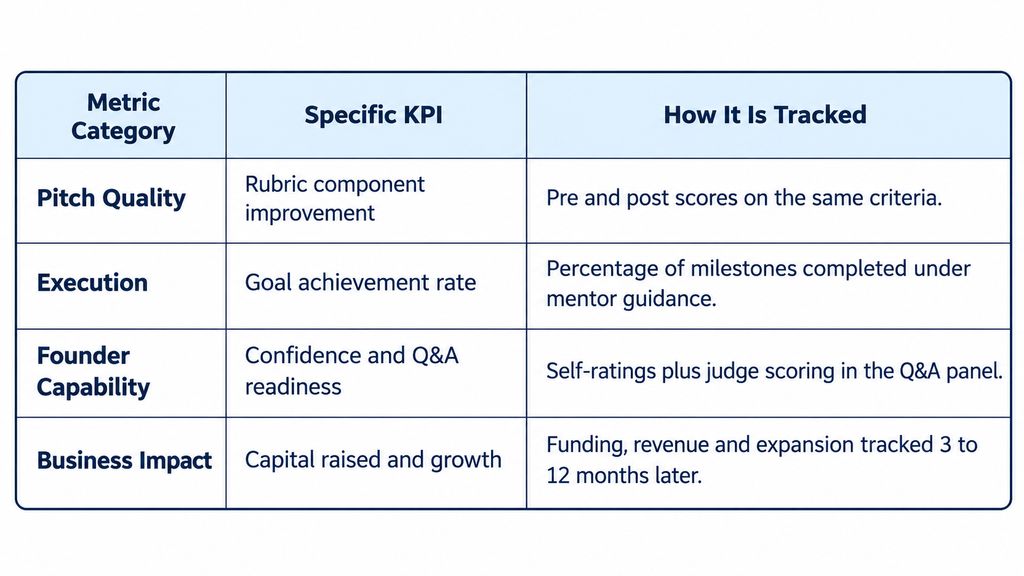
Four rows. That’s the whole skeleton. Everything else in this guide hangs on it.
Why Is Mentor Hours a Vanity Metric?
Because a packed calendar says nothing about whether the pitch got better.
I’ve seen founders log forty hours with mentors and walk on stage with the same muddled market slide they had on day one. I’ve also seen a founder take two sharp conversations, rip up her entire go-to-market story, and win the room. Hours measured the first founder as “highly engaged”. Hours missed the second one completely.
Engagement data isn’t useless, mind you. Participation rate and session completion rates tell you whether the mentoring relationship exists at all. One LinkedIn piece on mentor program success suggests active participation above 70% as a healthy threshold. Fine. Treat that as a floor, though, never as a finish line.
Activity is an input. Improvement is the result. Don’t confuse them.
How Do You Measure Pitch Quality Before and After Mentorship?
Score the pitch twice, on the same rubric, with the same kind of judges. That’s it. The discipline is in not cheating on the second part.
Baseline Rubric Scores
Pick the pillars: business model, market opportunity, traction, presentation clarity. Score the founder’s early draft before any mentor touches it. This guide on judging startup pitch competitions lays out standard rubric criteria of this kind, and if mentored founders gain noticeably more on “traction and validation” than unmentored peers, you’ve got a real signal.
The improvement formula is plain. Final score minus baseline score, divided by baseline, times 100. Execviva’s mentoring KPI breakdown uses this kind of percentage-improvement logic to link feedback to output scores.
Q&A Readiness Scores
A three-minute script can be rehearsed until it shines. Anyone can memorise a script.
Investor questions are a different animal. “Why will customers pay N15,000 a month when the free option is good enough?” That question exposes whether the mentor’s advice actually sank in. So score Q&A separately: clarity of answer, evidence cited, composure, and whether the founder admitted what they don’t yet know (which, oddly enough, judges tend to reward).
Judge Feedback Comparison
Compare written judge comments across rounds. If round-one judges said “unclear who the customer is” and round-two judges say nothing about it, that complaint has been resolved. Code the comments into themes, count how many repeat, and watch the repeats shrink. A bit tedious. Worth it.
Which Goals Should Mentors Help Founders Achieve?
Concrete ones. Vague goals like “improve the business” can’t be measured, and what can’t be measured will quietly be forgotten.
Milestone Completion Rate
Before mentoring starts, mentor and mentee agree on three to five milestones tied to the pitch. At the end, count how many were hit. Percentage complete is your goal achievement rate. An Individual Development Plan, even a one-page version, works as the tracking document, and it forces the mentor to hold the founder accountable rather than just chat.
Customer Discovery Targets
Set a number. Twenty customer interviews in three weeks, for example. Not “talk to some customers”. A number turns advice into something auditable, and it gives judges real traction evidence to question.
Unit Economics Refinement
This one separates serious founders from enthusiastic ones. Did the mentee arrive with no clue about customer acquisition cost and leave with a defensible CAC, gross margin and payback period? Track whether the numbers on the final slide are better supported than the numbers on the first draft. Better doesn’t always mean prettier. Sometimes the honest numbers look worse, and that’s progress too.
How Do You Measure Founder Confidence and Strategic Change?
Confidence sounds fluffy, but it’s measurable. Ask mentees to self-rate their comfort presenting under pressure at the start, the midpoint and the end, on a simple 1 to 5 scale. Mentornity’s evaluation framework recommends exactly this baseline, midpoint and end-of-cycle rhythm. Pair the self-rating with an outside view: judge scores or a mentor’s rating, because founders are famously poor at judging themselves, in both directions.
Strategic change is the second half. Did the founder take hard feedback and actually pivot? Maybe they dropped a segment, changed pricing, or rewrote the problem statement. Log each major change and trace it back to a mentor conversation. That’s your strategic pivot execution count. A mentee who nods politely and changes nothing has given you a very expensive data point.
Set Clear Objectives and Collect Reliable Data
Measurement is mostly set-up work. Do it badly at the start and no dashboard will rescue you later.
Baseline Assessments
Write the program goals down first. Is the contest chasing venture capital, local community impact, or job creation? The answer decides your KPIs. Then run baseline assessments before pairing begins: rubric scores, confidence ratings, current revenue, number of customers spoken to.
No baseline, no claim. Simple as that.
Surveys and Tracking Tools
Keep surveys short. Five to eight questions, mixing ratings with one open-ended prompt. A shared spreadsheet or a lightweight CRM is enough for most contests; fancy mentoring software is nice but optional. For deeper methods, this guide on evaluating mentorship impact covers skill assessment feedback loops and session-analysis protocols.
Follow-Up Schedule
Put dates in the calendar now: end of mentorship, three months, six months, twelve months. Assign one person to chase founders. Response rates collapse when nobody owns the follow-up, and your best-performing mentees are usually the busiest and slowest to reply.
Track Funding, Follow-On Meetings, and Business Growth
This is where the real verdict lives.
Funding Conversion Rate
Divide the number of mentored startups that closed capital by the total number mentored. Include follow-on investor meetings too, since a second meeting often precedes a cheque by months. A Medium reflection on Techstars Mentor Madness is a useful reminder that follow-up meetings and introductions per founder are countable outcomes.
Revenue and Expansion
Track monthly revenue, customer count, new markets, hires. For Nigerian startups, add naira-denominated revenue and note currency swings, because a founder whose revenue “dropped” in dollars may have grown in naira. Research on business mentoring among selected Nigerian enterprises ties mentoring to enterprise success in precisely this setting.
3 to 12 Month Review
Check at three, six and twelve months. Short windows catch quick wins. Long windows catch survival. Compare against non-mentored contest entrants if you can, because a meta-analysis of accelerator studies is a reminder that advisory impact needs proper comparison to be believed.
How Do You Interpret and Report Results to Stakeholders?
Lead with the outcome, then show the evidence trail. Sponsors don’t want twelve charts. They want to know whether their money moved something.
Open with one sentence: “Mentored founders improved rubric scores by an average of 28% and 40% secured follow-on meetings within six months.” Then give the baseline, the method, the sample size, and the gaps. Say what you couldn’t measure. That honesty builds more trust than polish does.
Match the metric to the audience. Funders care about capital raised and ROI. Mentors care about whether their advice stuck. Founders want to know which feedback paid off. One report rarely serves all three, so write short versions for each.
And watch causation. A founder who improved might have improved anyway. Flag that.
Which Common Measurement Pitfalls Should You Avoid?
Relying on satisfaction scores alone is the big one. Mentees almost always say they enjoyed it; people like being helped. Satisfaction measures mood.
Other traps are sneaky:
- Skipping the baseline, so there’s nothing to compare against.
- Counting only winners, which inflates success through survivorship bias.
- Measuring too soon, before funding or revenue effects show up.
- Collecting forty metrics and acting on none.
Pick a handful of KPIs, stick with them across cohorts, and protect the data quality. Consistency beats cleverness.
How Do You Know if Winning the Contest Reflects Mentorship Impact?
Often it doesn’t. Winning is overrated as the main measure.
Judges’ preferences, a lucky running order, a strong cohort or a weak one, all swing results. A mentored founder can lose and still leave with a sharper model, three investor intros and a signed pilot customer. An unmentored founder can win on charisma alone.
So compare gains, not placements. Look at score improvement, milestone completion and later funding, then ask whether mentored founders outperformed the rest on those. Placement is one data point, and a noisy one.
FAQ
What is the single best metric for mentorship in pitch contests?
No single one carries it. If forced, I’d pick pre and post rubric improvement, because it isolates what mentoring changed in the pitch itself.
How long after the contest should I keep tracking?
Twelve months is a sensible window, with checks at three and six months. Shorter misses real outcomes.
Can small contests measure this without expensive software?
Yes. A spreadsheet, a consistent rubric and a follow-up reminder do most of the work.
Is ROI calculable for mentorship?
Roughly. Compare capital raised, revenue gained or jobs created against program cost, and be upfront about attribution limits.
Conclusion
Mentoring in pitch contests only earns its reputation when you can show a founder got better, did more, and grew afterwards. Score the pitch before and after. Track hard milestones. Test Q&A. Then keep watching for a year.
Hours logged and smiles collected are comfortable numbers. They’re also nearly useless.
So which would you rather defend in front of a sponsor: a pretty satisfaction chart, or a table showing mentored founders closing funding at twice the rate?